Reduce Turnover with Data-Driven Team Design

TL;DR:
- Fragmented HR data hampers effective team design and early risk detection.
- Building a unified dataset from multiple sources enables predictive analytics and targeted interventions.
- Explaining, trusting, and acting on data insights are crucial for successful data-driven retention efforts.
Turnover costs employers roughly 33% of a worker’s salary to replace them, and for companies growing past 20 employees, that number adds up fast. Yet most HR teams still rely on manager gut feelings, exit interviews that arrive too late, or single-source metrics that only tell part of the story. The good news? A practical methodology for reducing attrition integrates data from HRIS, performance reviews, engagement surveys, training logs, attendance, and exit interviews into one coherent picture. This article walks you through exactly how to build that picture, segment your workforce, predict flight risk, and close the loop with targeted interventions that actually move the needle.
Table of Contents
- Why team design often fails without data
- Building a unified workforce dataset
- Segmenting teams and predicting risk: the analytics workflow
- Turning analytics into retention: measurement and intervention loops
- What most HR teams miss about data-driven team design
- Put data to work: Next steps for your HR team
- Frequently asked questions
Key Takeaways
| Point | Details |
|---|---|
| Unify your HR data sources | Integrated datasets reveal key team and retention patterns hidden from fragmented data. |
| Segment and model for action | Predictive analytics uncover unique flight risks for targeted, impactful interventions. |
| Prioritize explainable insights | Use tools like SHAP to demystify model results and empower confident HR decision-making. |
| Close the feedback loop | Dashboards and regular reviews ensure continuous improvement and quantifiable turnover reduction. |
Why team design often fails without data
To understand the need for integrated approaches, let’s examine the shortcomings of relying only on experience or simple metrics.
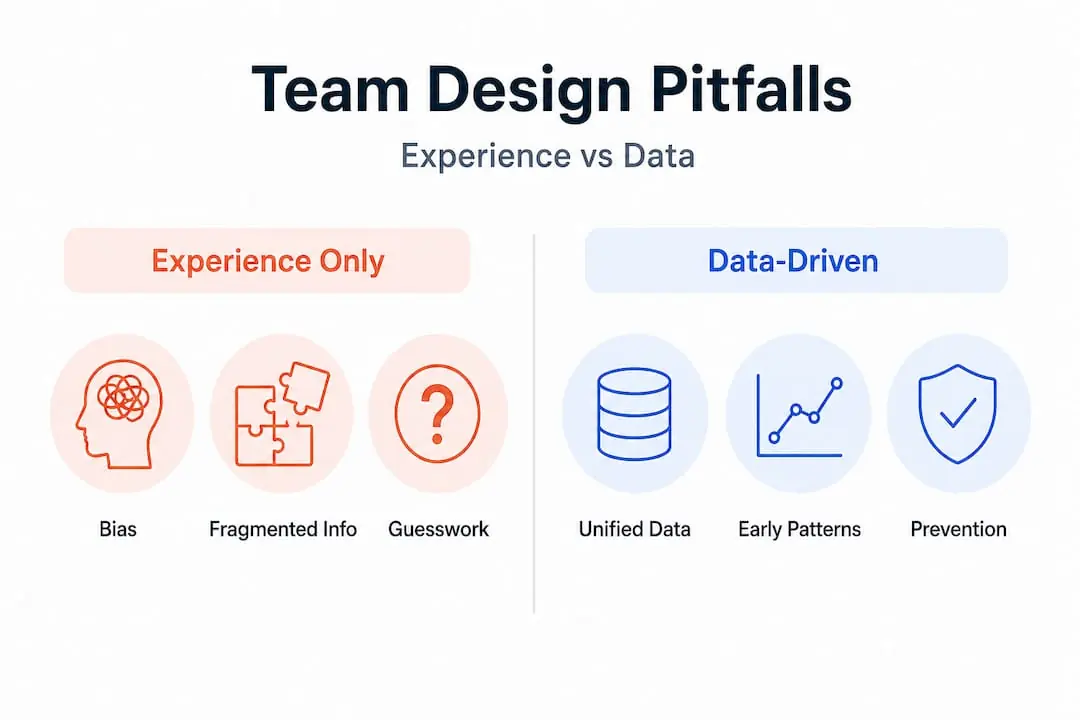
Most team design decisions happen in conference rooms, not data dashboards. A department head thinks they know who should lead the new project team. An HR business partner has a “feeling” about which employees are disengaged. These instincts are not worthless, but when they operate without data to validate them, they carry hidden costs.
The core problem is fragmentation. Many companies track performance scores in one system, engagement survey results in another, and attendance records in a spreadsheet no one opens after Q1. Integrating data from HRIS, performance reviews, and engagement surveys is critical for reliable team design, yet most organizations treat these sources as separate islands. That fragmentation makes it nearly impossible to spot patterns early, especially when an employee is quietly disengaging months before they hand in their resignation.
Intuition also carries a less obvious risk: it amplifies bias. When managers rely on familiarity and comfort, they tend to keep teams structured in ways that mirror the past. High-potential employees in mismatched roles get overlooked. New hires with different communication styles get labeled “difficult” rather than “misplaced.” Analytics for employee fit helps cut through those assumptions by surfacing patterns that human observation misses.
Here’s what typically goes wrong with intuition-only team design:
- No baseline. Without historical data, there’s nothing to compare current performance or engagement against.
- Reactive decisions. HR only acts after someone resigns, not before they decide to look elsewhere.
- Role mismatches. Employees land in positions that conflict with their natural working style, which tanks both productivity and satisfaction.
- Inconsistent criteria. Different managers apply different standards, making cross-team comparisons unreliable.
“The organizations that reduce attrition most effectively are the ones that stop treating HR data as a reporting function and start treating it as a decision-making tool.” This mindset shift is what separates reactive HR from genuinely strategic workforce design.
Pro Tip: Before you invest in new analytics tools, audit what data you already collect and whether any of it is currently used to make team design decisions. Most companies are sitting on valuable, untapped signals.
Unified datasets allow HR teams to detect these patterns early and shift from firefighting to prevention. That’s where transforming team potential becomes a realistic goal rather than a motivational phrase.
Building a unified workforce dataset
Now, with the problems of isolated data clear, let’s detail how to build a holistic, unified dataset for real impact.
A unified workforce dataset is not a single massive spreadsheet. It’s a connected ecosystem where different HR data sources talk to each other, enabling you to see each employee in context rather than in isolation. Building a unified workforce dataset means combining HRIS, performance, engagement, attendance, and exit interview data into one coherent structure.
Here are the six data sources you should prioritize:
- HRIS records. Demographics, job titles, tenure, compensation history, and reporting structure. This is your backbone.
- Performance reviews. Ratings, goal completion rates, manager feedback, and peer review scores across review cycles.
- Engagement survey results. Frequency, scores by category (manager relationship, workload, career growth), and trend lines over time.
- Attendance and time-tracking logs. Absenteeism patterns, overtime trends, and schedule consistency.
- Training and development records. Courses completed, certifications earned, and time since last learning activity.
- Exit interview data. Departure reasons, tenure at exit, role at exit, and self-reported satisfaction scores.
Combining these sources does not have to be an enterprise IT project. Many team management tools now offer native integrations with popular HRIS platforms, survey tools, and learning management systems. If you are working with a more fragmented tech stack, a simple ETL (Extract, Transform, Load) process, which pulls data from each source, standardizes it, and loads it into a central repository, can achieve the same result without a full system overhaul.
Here is a quick comparison of approaches for combining your HR data sources:
| Approach | Best for | Setup time | Cost level | Technical skill needed |
|---|---|---|---|---|
| Native platform integrations | Teams using modern HR SaaS | Low | Medium | Low |
| ETL pipeline | Custom or legacy systems | Medium | Low to medium | Medium |
| Manual data consolidation | Very small teams | Low | Low | Low |
| Full HR data warehouse | Large enterprises | High | High | High |
The goal of unification is end-to-end visibility. When you can see that an employee’s engagement score dropped three months after a role change, while their attendance became inconsistent and their last training activity was over a year ago, you have a very different conversation with their manager than if you only had their last performance rating. Tying these data sources in HR together is what makes prediction possible.
Segmenting teams and predicting risk: the analytics workflow
With unified data in hand, let’s walk through how to turn raw numbers into employee segments and predictive risks that drive smarter decisions.
Once your dataset is unified, the next step is segmentation. Not every employee faces the same attrition risks, and not every team has the same dynamics. Employee cohort segmentation and predictive modeling help identify unique attrition drivers and assess flight risk with far more precision than company-wide averages ever could.
Start by grouping employees along meaningful dimensions:
- Department and team. Engineering may face different burnout patterns than Sales.
- Role level. Individual contributors and team leads often have distinct engagement drivers.
- Tenure cohort. Employees in months 6 through 18 frequently show the highest flight risk as initial enthusiasm fades.
- Performance tier. High performers who are not advancing are at serious risk of being recruited away.
- Recent life events. Promotions, manager changes, team restructures, or compensation adjustments all shift risk profiles.
Once you have your segments, you apply predictive models. Logistic regression is a solid starting point because it is interpretable and works well with smaller datasets. As your data volume grows, machine learning models can detect more complex, nonlinear patterns. The machine learning for turnover risk literature consistently shows that combining behavioral signals (like engagement trends and absenteeism) with structural signals (like tenure and role fit) produces the most accurate risk scores.
But here’s where many HR analytics efforts stall: the model is built, a risk score is generated, and then nobody knows what to do with it. That’s why explainability matters enormously. Operationalization in HR is possible with interpretable model outputs such as SHAP (SHapley Additive exPlanations), which show exactly which factors drove each individual’s risk score. Instead of seeing “Employee X has a 78% flight risk,” a manager sees “Employee X’s risk is primarily driven by low engagement scores over three consecutive surveys and no career development activity in the past year.” That’s actionable.
Here’s a simplified view of how risk factors typically distribute across segments:
| Employee segment | Top attrition driver | Recommended intervention |
|---|---|---|
| High performers, mid-tenure | Lack of career progression | Promotion roadmap, stretch assignments |
| New hires (0 to 12 months) | Onboarding quality, team fit | Structured 90-day check-ins |
| Long-tenured, disengaged | Role stagnation | Job redesign or lateral move |
| Recently promoted | Role transition stress | Manager coaching, expectation alignment |
This kind of data-driven talent management approach means your retention budget goes to the employees who are actually at risk and for the right reasons, not based on a manager’s hunch. You can also find a practical retention guide to complement your analytics workflow with proven engagement tactics.

Pro Tip: Run your initial segmentation analysis on historical data first. Test whether your model would have predicted the departures that already happened. This validation step builds credibility with leadership and helps you refine the model before going live.
Team member segmentation based on personality and work style adds another layer of precision. Skills can be taught, but natural behavioral tendencies, communication preferences, and energy patterns are far more stable predictors of long-term role fit.
Turning analytics into retention: measurement and intervention loops
Predicting risk is only valuable if you close the loop. Let’s see how measurement and action cycles reduce turnover in practice.
A flight risk score sitting in a spreadsheet does nothing. What actually reduces turnover is a closed feedback loop where predictions trigger targeted interventions, and those interventions are tracked to measure their impact. Predictive modeling enables continuous tracking of turnover, engagement trends, and intervention effectiveness via dashboards.
Your measurement framework should track these core KPIs:
- Monthly and quarterly turnover rates by department, role level, and tenure cohort
- Engagement score trends before and after specific interventions
- Time-to-action from identifying a high-risk employee to completing the first intervention
- Retention rate among flagged employees who received targeted support
- Manager response rate to HR recommendations generated from the model
📈 Stat callout: Companies that implement structured, data-backed retention programs report measurably higher retention rates among their highest-risk employee segments within the first two quarters of operation, especially when interventions are personalized and timely rather than generic.
HR dashboards with interpretable outputs support real-time decision-making and targeted retention campaigns. A well-designed dashboard does not just show lagging indicators like last month’s turnover rate. It shows leading indicators, employees whose risk score increased this week, teams whose engagement scores dropped after a reorganization, and new hires who have not yet completed onboarding milestones.
The closed-loop part means you schedule regular review cycles. Monthly check-ins on high-risk employees, quarterly reviews of intervention outcomes, and annual reassessments of your segmentation model’s accuracy keep the whole system alive and improving. HR analytics for team design works best when it’s treated as an ongoing practice, not a one-time project.
Pro Tip: Assign ownership clearly. One of the most common reasons analytics programs fail is that no one is specifically responsible for translating dashboard insights into manager conversations and follow-up actions. Pair every risk alert with a named person who owns the response.
For teams looking to reduce administrative burden on this process, HR task automation tools can handle alert routing, check-in scheduling, and data refreshes automatically, freeing HR to focus on the human side of retention.
What most HR teams miss about data-driven team design
After walking through the framework, let’s address what truly sets lasting data-driven team design apart in real organizations.
Here’s the uncomfortable truth we’ve observed: most failed analytics initiatives are not technology failures. They’re change management failures. Companies invest in dashboards, predictive models, and data integrations, and then wonder why turnover doesn’t budge. The answer is almost always that managers never changed how they made decisions because nobody explained the model to them in plain language or helped them trust it.
Explainability is the piece that most HR teams skip. A manager who receives a report saying “three of your team members are high-risk” without any context about why those employees are flagged or what to do next will either ignore the alert or handle it poorly. The entire value of SHAP values and interpretable models is that they make the “why” visible. HR leaders need to insist on transparent, understandable outputs, not just impressive accuracy scores.
Leadership buy-in is equally non-negotiable. Data-driven team design requires managers to be honest about disengagement in their teams, to accept that shifting someone to a different role might be the right call even if it feels disruptive, and to follow through on recommendations consistently. Without that commitment at the leadership level, analytics stays a reporting exercise rather than a decision-making engine.
There’s also a deeper point that often goes unspoken. Skills-based assessments tell you what someone can do today. Personality-based assessments tell you how someone naturally operates, communicates, and handles stress. The latter is far more predictive of long-term fit and satisfaction. Cutting turnover with data works best when the data includes personality signals, not just performance history. That’s the frontier where the most exciting advances in team design are happening right now. ⚡️
Put data to work: Next steps for your HR team
Ready to take action? Here’s where you can find expert HR resources and proven tools to accelerate your team design success.
At Sparkly, we built our platform specifically for HR teams that are tired of making high-stakes team design decisions with incomplete information. We combine personality assessments, Human Design insights, psychometric data, and AI-driven analysis to give you a multi-source view of each employee’s natural strengths and ideal role fit. Because skills can be learned, but personality shapes how someone thrives in a team environment day after day.
If you’re ready to move beyond fragmented metrics and build a team design process grounded in evidence, start by exploring talent optimization explained to understand how personality-first assessments fit into your existing HR workflow. Then check out our guide on talent allocation methods for practical frameworks to shift team members into roles where they’ll genuinely perform and stay. 💡 Your data is already telling a story. Let’s make sure you’re reading it clearly.
Frequently asked questions
What types of HR data are most useful for team design?
Performance reviews, engagement surveys, attendance records, and exit interview data are the key sources for building high-impact teams, especially when combined into a unified dataset rather than analyzed in isolation.
How can predictive models actually help reduce employee turnover?
Predictive modeling tracks turnover and engagement trends continuously, allowing HR to spot flight risks weeks or months earlier and target retention efforts with personalized, data-backed interventions rather than blanket programs.
What is SHAP and why does it matter in HR analytics?
SHAP values provide individualized, interpretable risk assessments that make it easy for non-technical HR practitioners to understand exactly why a particular employee has been flagged as a flight risk and what factors to address.
Is intuition still valuable in designing teams?
Absolutely, but it works best as a complement to data rather than a replacement for it. Validated analytics help reduce the bias that intuition naturally carries and give managers a more objective foundation for their decisions.
How quickly can a company see results from data-driven team design?
Organizations can often measure meaningful improvements in retention and engagement within two to three months of consistently applying analytics-driven interventions, particularly when high-risk employee segments are identified and supported early.
Recommended
- Master Team Member Shifting Workflow for Optimal Teams
- How to Shift Team Members for Better Team Dynamics
- Data-driven talent management cuts turnover by 30% in 2026
- Why shift team members: Boost retention with personality fit in 2026
- Employee Retention Solutions, Lower Turnover | OpenElevator
- Beyond the Algorithm: Why Human Talent Is the Real Solution to Recent Layoffs