
10 Workforce Analytics Examples That Cut Turnover by 30%

Many HR teams collect mountains of employee data but struggle to transform it into decisions that actually move the needle on performance and retention. Modern workforce analytics bridge this gap by turning raw people data into clear, actionable insights that directly impact your bottom line. This article walks you through 10 practical workforce analytics examples that leading organizations use right now to reduce turnover, boost productivity, and make smarter talent decisions.
Table of Contents
- How workforce analytics drive business outcomes
- Key types of workforce analytics (with examples)
- 10 innovative workforce analytics examples in action
- Comparing workforce analytics: strengths and best-fit scenarios
- How to get started with workforce analytics in your company
- Boost your workforce analytics with leading HR solutions
- Frequently asked questions
Key Takeaways
| Point | Details |
|---|---|
| Analytics link to real business value | The right workforce analytics improve performance, retention, and HR alignment with business goals. |
| Top 10 examples for HR success | Applying analytics like turnover modeling and skills gap analysis leads to actionable talent insights. |
| Choose analytics that fit | Evaluate use cases based on your data readiness, company size, and business priorities. |
| Stepwise implementation wins | Begin with one or two use cases in a pilot before scaling analytics efforts across your HR team. |
How workforce analytics drive business outcomes
Workforce analytics is the practice of collecting, analyzing, and interpreting employee data to inform strategic HR and business decisions. Too many leaders confuse it with simple headcount reporting or basic HR metrics. Real workforce analytics goes deeper, revealing patterns in employee behavior, predicting future outcomes, and recommending specific actions to improve results.
High-impact analytics share three essential characteristics: they’re measurable (backed by quantifiable data), relevant (tied to actual business goals), and actionable (they lead to concrete next steps). When you apply these criteria, workforce analytics directly influences three critical business outcomes:
- Performance improvement: Identifying top performers’ traits and replicating success across teams
- Engagement enhancement: Spotting early warning signs of disengagement before they escalate
- Retention optimization: Data-driven talent management cuts turnover by 30% when applied consistently
The most successful organizations treat workforce analytics as a strategic capability, not just an HR reporting function. They integrate insights from HR analytics into leadership discussions, budget planning, and organizational design. This shift from reactive reporting to proactive decision-making separates companies that merely track people data from those that truly leverage analytics to improve employee fit and business results.
“Organizations using workforce analytics strategically see measurable improvements in talent outcomes within the first year of implementation.â€
Key types of workforce analytics (with examples)
Workforce analytics falls into three main categories, each serving a distinct purpose in your talent strategy. Understanding these types helps you choose the right approach for your current data maturity and business needs.
Descriptive analytics answers the question “What happened?†by summarizing historical data. A common example is turnover reporting by department, which shows you where attrition is highest over the past year. This foundational analytics type requires minimal technical sophistication but provides essential context for deeper analysis.

Predictive analytics tackles “What will happen?†by using patterns in historical data to forecast future outcomes. For instance, you might analyze employee engagement scores, tenure, promotion history, and manager ratings to predict which team members are most likely to resign in the next six months. This allows you to intervene proactively with retention strategies.
Prescriptive analytics goes furthest by recommending “What should we do?†based on predicted outcomes. An example is a system that identifies performance gaps across your organization and automatically suggests personalized learning pathways for each employee. This analytics type delivers the highest value but requires mature data infrastructure and analytical capabilities.
Pro Tip: Start with descriptive analytics if your data maturity is low, and build upward. Trying to jump straight to prescriptive analytics without solid descriptive foundations leads to unreliable recommendations and wasted resources.
These analytics types aren’t mutually exclusive. The most effective talent analytics for HR strategies combine all three, using descriptive insights to inform predictive models and prescriptive recommendations. As your analytical maturity grows, you’ll naturally progress from simple reporting to sophisticated, automated decision support that transforms how you manage talent. Modern recruitment technology trends increasingly incorporate all three analytics types into integrated platforms.
10 innovative workforce analytics examples in action
Let’s explore ten practical workforce analytics use cases that deliver measurable business impact. Each example includes a real-world scenario, the specific purpose it serves, and the tangible benefits you can expect.
1. Flight risk analysis: A technology company noticed sudden spikes in voluntary turnover among mid-level engineers. By analyzing engagement survey responses, promotion timelines, compensation data, and manager feedback, they built a flight risk model that flags employees with 80% accuracy three months before resignation. This early warning system allows targeted retention conversations and career development interventions.
2. Skills gap mapping: A manufacturing firm struggling with digital transformation used workforce analytics to compare current employee skills against future role requirements. The analysis revealed specific technical competencies missing across 40% of their workforce, enabling them to design targeted upskilling programs rather than expensive external hiring.
3. Promotion prediction modeling: An insurance company analyzed historical promotion data to identify which factors truly predict advancement success. They discovered that cross-functional project experience mattered more than tenure, leading them to redesign their talent development programs and create more equitable promotion pathways.
4. Absenteeism trend analysis: A healthcare organization tracked absence patterns across departments and shifts. The analytics revealed that Monday morning absences spiked 35% in units with specific managers, pointing to leadership issues rather than employee problems. This insight drove targeted management coaching that reduced overall absenteeism by 18%.
5. Performance driver identification: A retail chain used analytics to determine which factors most strongly correlated with sales performance. Surprisingly, they found that personality traits related to resilience and adaptability predicted success better than previous retail experience, completely reshaping their hiring criteria.
6. Engagement pulse tracking: A professional services firm implemented weekly pulse surveys and used analytics to track engagement trends in real time. When scores dropped in specific teams, HR could intervene within days rather than waiting for annual survey results, preventing three major team departures.
7. Compensation equity analysis: A financial services company analyzed pay data across demographics, roles, and performance levels. The analytics uncovered unintentional gender pay gaps in certain job families, allowing them to make corrective adjustments before facing legal or reputational risks.
8. Succession planning optimization: A global manufacturer used workforce analytics to identify high-potential employees and map them against critical roles. The system monitors and enhances productivity while flagging succession gaps 18 months in advance, giving ample time for development.
9. Onboarding effectiveness measurement: A software company tracked new hire performance, engagement, and retention against different onboarding program variations. Analytics revealed that buddy program participation increased 90-day retention by 25%, leading to company-wide onboarding redesign.
10. Team composition optimization: A consulting firm analyzed project outcomes against team composition variables like personality diversity, skill mix, and experience levels. The insights enabled them to assemble teams with 30% higher client satisfaction scores by balancing complementary strengths.
Here’s how these analytics examples compare in terms of data requirements and delivered value:
| Analytics Example | Primary Data Sources | Key Value Delivered |
|---|---|---|
| Flight risk analysis | Engagement surveys, HRIS, performance data | 30% reduction in regrettable turnover |
| Skills gap mapping | Skills assessments, job requirements, training records | Targeted upskilling, reduced external hiring costs |
| Promotion prediction | Historical promotion data, performance ratings | More equitable advancement, improved retention |
| Absenteeism trends | Attendance records, manager data, shift schedules | 15-20% reduction in unplanned absences |
| Performance drivers | Sales data, personality assessments, experience records | Improved hiring accuracy, faster ramp time |
| Engagement pulse | Weekly surveys, team metrics, project data | Real-time intervention, prevented departures |
| Compensation equity | Payroll data, demographics, performance ratings | Reduced legal risk, improved fairness |
| Succession planning | Performance data, potential assessments, role criticality | Reduced leadership gaps, smoother transitions |
| Onboarding effectiveness | New hire surveys, retention data, program variations | 25% improvement in early retention |
| Team composition | Project outcomes, personality data, skills inventory | 30% higher client satisfaction |
Each analytics use case addresses specific business challenges. The key is selecting examples that align with your most pressing organizational needs, whether that’s reducing turnover through data-driven talent management or improving team performance through better composition. Organizations increasingly combine these approaches with machine learning for HR to automate insights and scale impact across larger workforces.
Comparing workforce analytics: strengths and best-fit scenarios
Not all workforce analytics examples deliver equal value in every situation. The right choice depends on your organization’s size, data maturity, and most urgent business challenges. This comparison helps you prioritize which analytics to implement first.
| Analytics Type | Implementation Ease | Typical ROI Timeline | Best For | Data Maturity Required |
|---|---|---|---|---|
| Absenteeism trends | High | 3-6 months | Organizations with attendance issues | Low |
| Engagement pulse | High | 3-6 months | Fast-growing companies, high-change environments | Low to Medium |
| Compensation equity | Medium | 6-12 months | Companies facing pay transparency pressure | Medium |
| Skills gap mapping | Medium | 6-12 months | Organizations undergoing transformation | Medium |
| Onboarding effectiveness | Medium | 6-12 months | High-volume hiring companies | Medium |
| Performance drivers | Medium | 6-12 months | Sales organizations, customer-facing roles | Medium |
| Flight risk analysis | Low | 12-18 months | Companies with high turnover costs | High |
| Promotion prediction | Low | 12-18 months | Large organizations with defined career paths | High |
| Succession planning | Low | 12-18 months | Organizations with critical leadership gaps | High |
| Team composition | Low | 12-18 months | Project-based or matrix organizations | High |
Company size significantly influences which analytics examples work best. Smaller organizations (under 100 employees) should focus on high-impact, easy-to-implement options like engagement pulse tracking and absenteeism analysis. Mid-sized companies (100-1,000 employees) can tackle medium-complexity analytics like skills gap mapping and compensation equity. Large enterprises (over 1,000 employees) have the data volume and resources to justify sophisticated approaches like flight risk modeling and team composition optimization.
Data complexity matters just as much as company size. If your HRIS data is incomplete or inconsistent, start with analytics that require fewer data sources. Absenteeism trends and engagement pulse tracking work well with limited data infrastructure. As you clean up your data and integrate systems, you can progress to analytics requiring multiple data sources like HR analytics that transforms team potential.
Pro Tip: Prioritize analytics examples aligned with urgent organizational goals. If turnover is your biggest pain point, flight risk analysis and onboarding effectiveness should top your list, even if they’re harder to implement. The business case for tackling critical problems justifies the investment in data infrastructure and analytical capabilities.
Readiness assessment is crucial before launching any workforce analytics initiative. Ask yourself: Do we have clean, accessible data? Do we have analytical talent or budget for external support? Will leadership act on insights, or will they sit in reports? Organizations that honestly evaluate readiness avoid false starts and build sustainable analytics capabilities. The most successful implementations start small, prove value quickly, and scale based on demonstrated ROI rather than ambitious plans that never materialize. Understanding how analytics improves employee fit helps you set realistic expectations and measure progress effectively.
How to get started with workforce analytics in your company
Launching workforce analytics doesn’t require a massive technology investment or a team of data scientists. Follow these practical steps to build analytical capabilities that deliver real business value.
-
Audit available HR data and select an initial analytics goal: Start by cataloging what employee data you currently collect in your HRIS, performance management system, engagement surveys, and other sources. Assess data quality, completeness, and accessibility. Then choose one specific business problem to address, such as reducing turnover in a critical department or improving time-to-productivity for new hires. This focused approach prevents analysis paralysis and demonstrates value quickly.
-
Involve stakeholders from HR, IT, and business units: Workforce analytics succeeds only when cross-functional teams collaborate. HR brings domain expertise and business context. IT ensures data security, integration, and technical feasibility. Business unit leaders provide the operational perspective and will ultimately act on insights. Schedule a kickoff meeting where all stakeholders align on the analytics goal, success metrics, and timeline.
-
Choose a pilot use case and define success metrics: Select an analytics example from the list above that matches your goal, data availability, and organizational readiness. For instance, if reducing turnover is your priority and you have engagement survey data, flight risk analysis makes sense. Define clear success metrics upfront, such as “identify 75% of at-risk employees three months before resignation†or “reduce turnover in target department by 15% within one year.â€
-
Roll out improvements and communicate wins: Once your analytics reveal insights, translate them into specific actions. If flight risk analysis flags high-potential employees considering departure, implement targeted retention conversations and career development plans. Track whether these interventions work and share results widely. Communicating early wins builds organizational support for expanding analytics capabilities. Even small successes, like preventing two key departures, justify continued investment.
-
Scale analytics maturity over time: After proving value with your pilot, gradually expand to additional use cases and more sophisticated analytics types. Move from descriptive to predictive to prescriptive analytics as your data infrastructure and analytical skills mature. Invest in training for HR team members or hire specialized talent. Consider analytics platforms that automate insights and integrate with your existing systems.
Successful analytics implementation is stepwise, not all-at-once. Organizations that try to build comprehensive analytics capabilities overnight typically fail. Those that start small, learn fast, and scale based on demonstrated value create sustainable competitive advantages. The job analysis process provides a solid foundation for many workforce analytics initiatives by clarifying role requirements and success factors.
Timing matters too. Don’t wait for perfect data or ideal conditions. Start with the data you have, acknowledge limitations, and improve iteratively. The insights from imperfect analytics often exceed the value of delayed perfection. Your first workforce analytics project teaches you as much about organizational readiness and change management as it does about employee behavior patterns.
Boost your workforce analytics with leading HR solutions
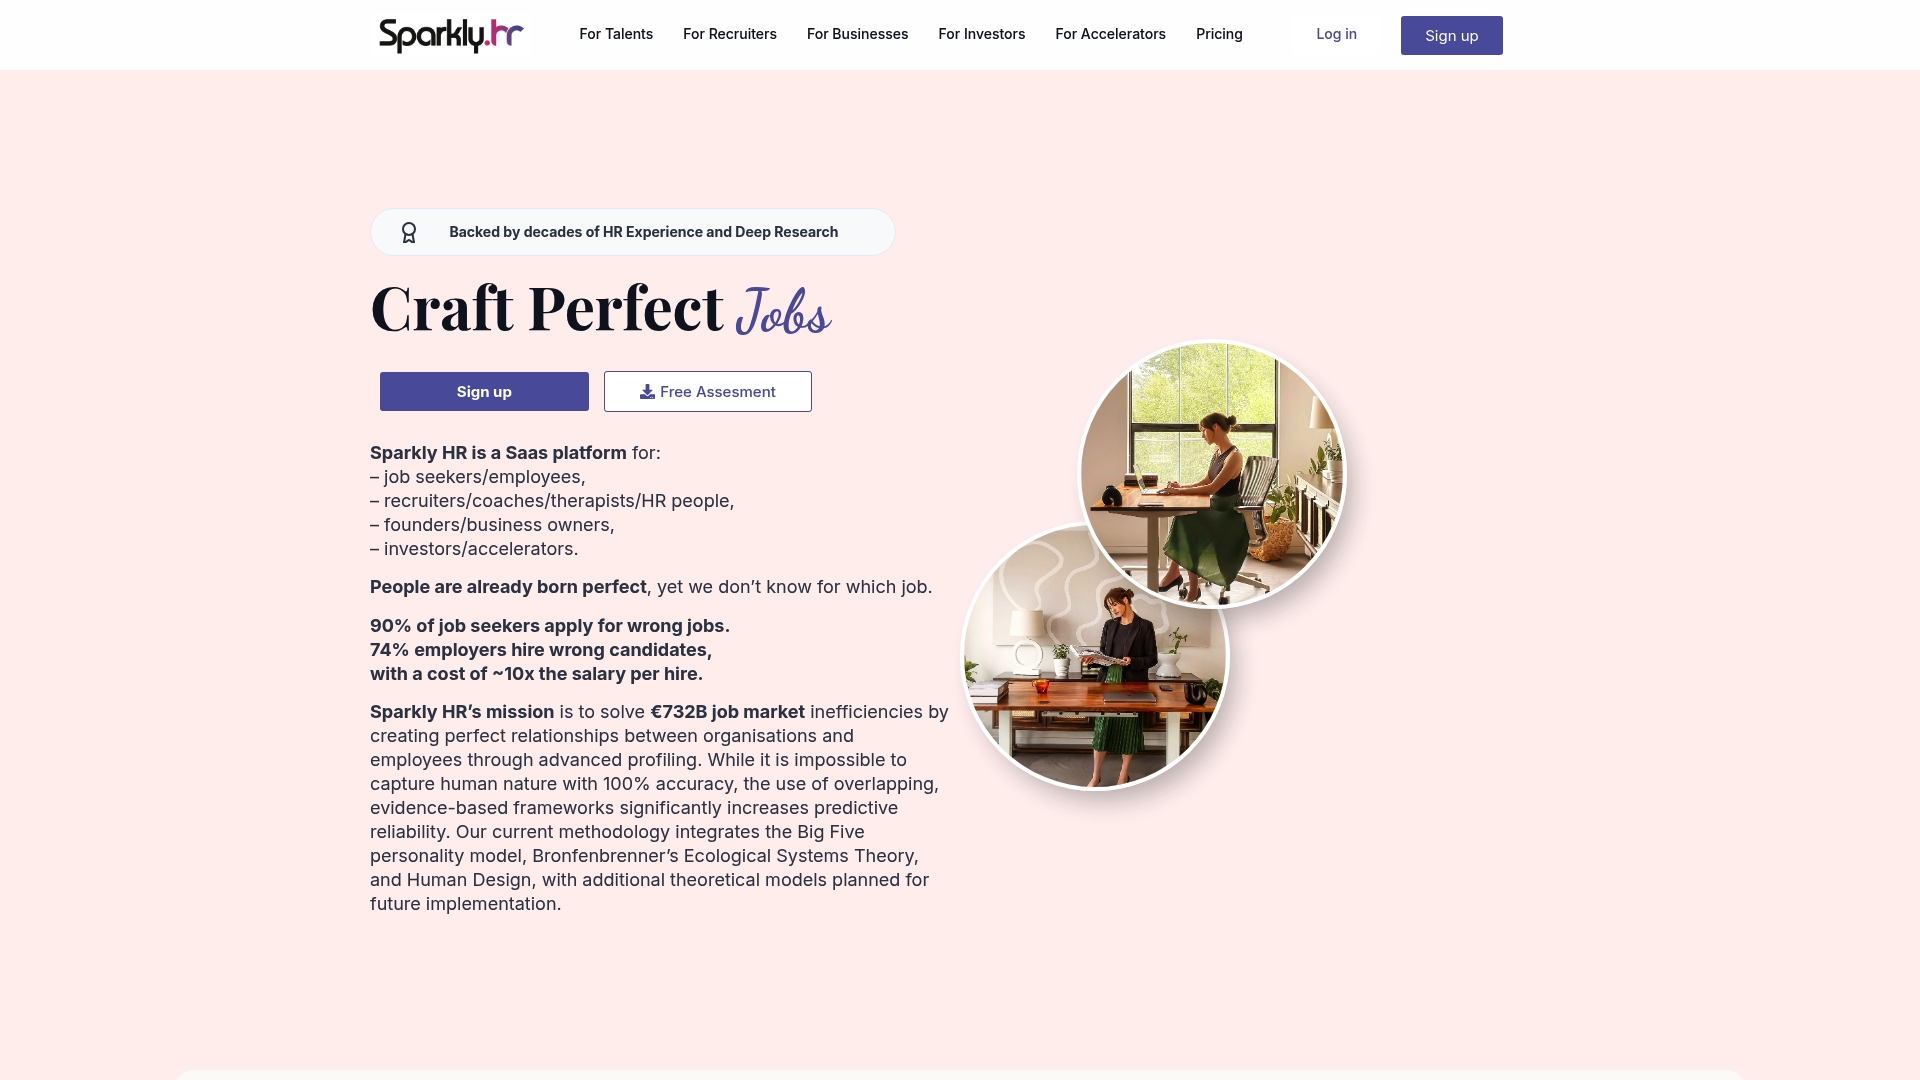
Ready to transform your people data into strategic advantage? Sparkly HR specializes in workforce analytics that go beyond surface-level metrics to reveal the personality traits, team dynamics, and role fit factors that truly drive performance. Unlike traditional analytics that focus solely on skills and experience, Sparkly merges insights from AI, psychometric assessments, Human Design, and human judgment to deliver higher-probability predictions about employee success and retention.
Our platform helps you implement the workforce analytics examples covered in this article, from flight risk analysis to team composition optimization. We assess personality primarily because skills can be learned, but core behavioral traits predict long-term fit and performance. This approach gives HR professionals actionable insights for interviews, team assignments, and development planning that traditional analytics miss.
Explore how SaaS solutions in HR are revolutionizing talent decisions, or dive into our guide on the top talent evaluation SaaS platforms to find the right tools for your organization. Our talent management platform integrates seamlessly with your existing HRIS to deliver insights without disrupting your workflows. Book a consultation today to discover how Sparkly HR can help you cut turnover, boost performance, and make smarter talent decisions through advanced workforce analytics.
Frequently asked questions
What is the difference between workforce analytics and HR analytics?
Workforce analytics emphasizes employee behavior and outcomes like performance, engagement, and retention, while HR analytics includes broader HR processes such as recruiting efficiency, compliance tracking, and benefits administration. Workforce analytics is a subset focused specifically on people outcomes.
Which types of workforce analytics most impact retention?
Turnover analysis, flight risk modeling, and engagement predictors are most effective for improving retention rates. Organizations using analytics to reduce turnover by 30% typically combine all three approaches to identify at-risk employees early and intervene with targeted retention strategies.
How does workforce analytics improve team performance?
It uncovers the specific factors that drive performance in your organization, such as personality traits, skill combinations, or team composition patterns. Analytics improves team potential by suggesting targeted interventions for teams and individual employees based on data rather than intuition.
What data do I need for workforce analytics?
Key sources include your HRIS for demographic and tenure data, engagement surveys for sentiment tracking, performance management systems for ratings and goals, and compensation records for equity analysis. Start with whatever data you have and expand sources as your analytics mature.
How long does it take to see results from workforce analytics?
Results can appear in as little as three months when focusing on a specific HR or business outcome like reducing absenteeism or improving onboarding effectiveness. More complex analytics like flight risk modeling typically show measurable impact within 12 to 18 months.