
The HR Data Interpretation Process: A 2026 Guide

TL;DR:
- Interpreting HR data effectively requires asking specific questions and ensuring data quality before analysis.
- Using appropriate analytics levels and triangulating insights with qualitative sources helps prevent costly misinterpretations.
Getting workforce data is the easy part. Making sense of it — and doing something useful with it — is where most HR teams struggle. The hr data interpretation process is the structured bridge between raw numbers and real organizational decisions, and when it breaks down, the consequences are costly. Misread attrition signals lead to the wrong retention programs. Poorly analyzed engagement scores produce interventions that miss the actual problem. This guide gives you a practical, step-by-step framework for interpreting HR data with confidence, accuracy, and the ethical grounding that 2026’s regulatory environment demands.
Table of Contents
- Key Takeaways
- The HR data interpretation process starts before you open the data
- Techniques for interpreting employee data accurately
- Turning HR metrics evaluation into real decisions
- Troubleshooting common problems in HR analytics
- Validating insights and staying ethically compliant
- My take: data is only as good as the judgment behind it
- How Sparkly helps you interpret people data with confidence
- FAQ
Key Takeaways
| Point | Details |
|---|---|
| Frame the problem first | Define a clear HR question before pulling any data to avoid drowning in irrelevant metrics. |
| Match analytics level to decision need | Use descriptive, diagnostic, predictive, or prescriptive methods based on what your situation actually requires. |
| Confidence checks prevent costly errors | Weak or narrow data should pause decision-making, not accelerate it. |
| Triangulate across sources | Validate insights by cross-referencing multiple data streams and lived employee experience. |
| Document everything | Transparent records of assumptions and limitations protect both your team and your organization. |
The HR data interpretation process starts before you open the data
Most HR professionals skip straight to the dashboard. That’s the single biggest mistake in data analysis in HR. Google re:Work frames this as a progression from opinion to informed action, and the process starts with a clearly defined question, not a metric.
Before you touch the data, ask yourself what specific HR problem you are trying to solve. “We want to reduce turnover†is not a question. “Why are mid-level engineers in the product team leaving within 18 months of hire?†is. That specificity determines which metrics matter and which are noise.
Once the question is set, data readiness checks are non-negotiable. Here’s what to audit before analysis begins:
- Data completeness: Are there meaningful gaps in your records? Missing exit interview data or incomplete performance reviews will skew every conclusion.
- Consistency: Are the same fields captured the same way across departments and time periods? Inconsistent job title taxonomies, for example, make segmentation unreliable.
- Single source of truth: If your HRIS, payroll system, and engagement platform all report headcount differently, you need to reconcile them before proceeding. Investing in data hygiene is more critical than any analytics tool.
- Ethical and governance readiness: Are you collecting only what you need? Data minimization and disclosure of data quality limitations are baseline requirements under frameworks like the UK Data and AI Ethics Framework, and similar principles apply across most modern regulatory environments.
| HR metric category | Common examples | Decision area supported |
|---|---|---|
| Workforce stability | Turnover rate, retention rate, tenure | Retention strategy, workforce planning |
| Engagement and wellbeing | Engagement score, absenteeism, eNPS | Culture, manager effectiveness |
| Talent acquisition | Time-to-fill, offer acceptance rate | Recruiting process, employer brand |
| Performance and growth | Goal completion, promotion rate | L&D investment, succession planning |
Pro Tip: Write your hypothesis as a single sentence before opening any data tool. Example: “We believe new managers in the sales team show lower engagement scores because they receive insufficient onboarding support.†This discipline keeps your analysis focused and your conclusions honest.
Techniques for interpreting employee data accurately
The four levels of HR analytics are not just academic categories. They describe genuinely different types of questions, and mixing them up is one of the most common reasons HR analytics loses credibility with leadership.
- Descriptive analytics tells you what happened. Turnover was 14% last quarter. Engagement dropped 6 points year over year. This is the foundation, but it is not the conclusion.
- Diagnostic analytics tells you why. You segment, correlate, and compare. Was the turnover concentrated in a specific team, tenure band, or location? Diagnostic work generates hypotheses.
- Predictive analytics tells you what is likely to happen. Using historical patterns, you model which employees are at risk of leaving in the next 90 days or which hiring sources produce the highest 12-month retention.
- Prescriptive analytics tells you what to do. Given predicted burnout risk in your engineering team, prescriptive models recommend specific interventions, adjusted workloads, or structural changes.
The jump from descriptive to prescriptive is where most HR teams stall. The reason is usually not technology. It’s the absence of disciplined hypothesis testing at the diagnostic stage.
When testing hypotheses, watch for two statistical traps that consistently mislead HR teams. First, correlation does not imply causation. If high performers tend to have mentors, that does not mean assigning mentors creates high performance. Second, regression to the mean means that extreme results in one period often drift toward average in the next, regardless of any intervention you implement. Acting on a one-quarter anomaly as if it were a trend is expensive.
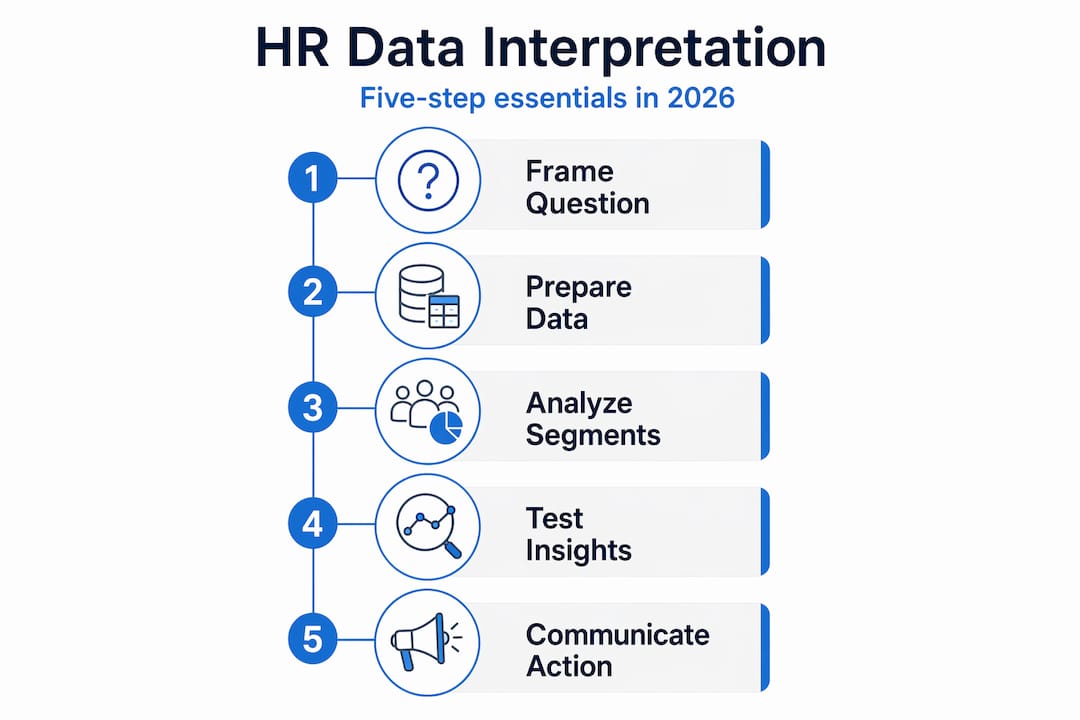
Segmentation is your most powerful interpretive tool when used correctly. Break your data by role type, tenure band, manager, location, and employment type. Patterns that are invisible in aggregate data become clear when you look at specific subgroups. A validated approach requires checking whether a pattern holds consistently across segments or exists only in one narrow slice before drawing any conclusions.
Finally, triangulate. HR metrics are rarely self-explanatory. A drop in engagement scores means something different if it coincides with a leadership change, a reorganization, or an external market shift. Cross-referencing quantitative data with qualitative sources like focus groups, exit interviews, and manager observations gives you the context that numbers alone cannot provide.
Pro Tip: When a data pattern looks surprising or too clean, treat that as a warning signal. Dig into the data collection process before drawing conclusions. Surprising results often reveal data quality issues rather than genuine workforce trends.
Turning HR metrics evaluation into real decisions
Good interpretation means nothing if you cannot communicate it effectively. The HR reporting process must translate numbers into a narrative that non-technical stakeholders can act on.

Data visualization best practices for HR are specific. Use bar charts for comparisons across groups, line charts for trends over time, and heat maps for identifying patterns across a two-dimensional grid like teams by engagement dimension. Avoid pie charts for anything with more than three categories. Clutter kills clarity.
When presenting to leadership, lead with the business implication, not the methodology. “Our mid-level talent pool is at high attrition risk, which represents approximately $2.4M in replacement costs over the next year†lands harder than “our voluntary turnover metric increased by 4 percentage points.â€
Here are practical approaches to turn interpreted data into action:
- Build a one-page insight brief for each significant finding: the question asked, the data used, the key finding, the confidence level, and the recommended action.
- Work with data specialists to stress-test your interpretations. If you do not have an internal people analytics team, external collaboration can expose blind spots.
- Set a decision threshold. Agree in advance on what level of evidence triggers action. This prevents both inaction due to perfectionism and overreaction to weak signals.
- Connect insights to team dynamics by exploring how team structures affect engagement at the structural level, not just the individual one.
Data literacy in HR means being able to ask the right questions, interpret dashboards, form recommendations, and tell a compelling story to influence decisions. Only 27% of HR professionals have received targeted training on interpreting the reports relevant to their work. That gap is a real organizational risk.
Pro Tip: Build a standing two-page template for every HR analytics project: hypothesis, data sources used, key findings with confidence ratings, limitations, and recommended actions. Consistency in how you document and present findings builds stakeholder trust faster than any single impressive result.
Troubleshooting common problems in HR analytics
Even rigorous processes produce flawed outputs. Knowing the warning signs of misinterpreted HR data helps you catch errors before they become policy mistakes.
Watch for these symptoms:
- Conclusions that confirm what leadership already believed. Confirmation bias in data selection is real. If your analysis only looked at data that supported a pre-existing view, the finding is not reliable.
- Recommendations based on a single data point or a single time period. Robust conclusions require pattern consistency across multiple data collection points.
- Insights that cannot be explained to a non-HR audience. If you cannot clearly articulate why the data shows what it shows, the interpretation likely has gaps.
- Acting on low-confidence findings. When your data is incomplete or covers too small a sample, pause rather than act. A wrong intervention often does more damage than no intervention.
Biased datasets are a specific risk in HR analytics. If your engagement survey has a 38% response rate, the 62% who did not respond are not randomly distributed. They are more likely to be disengaged, busy, or skeptical of the process. Acting on that 38% as if it represents the full workforce produces skewed strategy.
Building organizational trust in HR analytics is a long game. Start with smaller, clearly scoped analyses where results can be verified quickly. Deliver on your recommendations. Be transparent when an insight turns out to be wrong. Trust compounds over time when HR analytics has a track record of producing honest, accountable findings.
Validating insights and staying ethically compliant
Interpretation does not end when you reach a conclusion. Verification is the step that separates responsible HR analytics from educated guessing.
A practical confidence assessment for any HR insight should ask: Does this finding hold across multiple employee segments? Has it been triangulated with at least one qualitative data source? Is the sample size large enough to be statistically meaningful? Is the time period representative? If the answers are mostly no, the insight is a hypothesis, not a finding.
| Verification action | When to apply | Why it matters |
|---|---|---|
| Cross-segment validation | After any diagnostic finding | Prevents single-group bias skewing conclusions |
| Qualitative triangulation | Before prescriptive recommendations | Adds human context to numerical patterns |
| Data Protection Impact Assessment | High-risk AI-driven people analytics | Required for processing sensitive behavioral or predictive data |
| Audit trail documentation | Every significant analytics project | Supports governance and auditability for regulatory and internal review |
HR analytics insights must be documented transparently, including assumptions, limitations, and any data transformations applied. This is not bureaucratic box-ticking. It is what allows your team to revisit decisions, learn from outcomes, and maintain credibility with auditors and leadership alike.
Pro Tip: Run a quarterly “insight retrospective†where you revisit three past HR analytics conclusions and evaluate whether the predicted outcomes materialized. This practice sharpens interpretation skills faster than any training course.
My take: data is only as good as the judgment behind it
I’ve spent years watching HR teams invest in dashboards and then struggle to explain what the numbers actually mean for the business. The honest truth is that most HR analytics problems are not data problems. They are interpretation problems.
What I’ve learned is that the organizations making the best use of HR data share one thing: they start with a question, not a metric. They resist the pressure to measure everything and instead build disciplined inquiry habits. When I work with HR leaders, the first question I ask is not “what data do you have?†It’s “what decision are you trying to make?â€
I’ve also seen the damage done when people confuse analytics maturity levels. A descriptive report showing that women leave the company at higher rates is an important finding. But treating it as a prescriptive conclusion and implementing a single program without understanding the diagnostic “why†usually fails to move the needle. The misalignment between what the data shows and what action it actually supports is where well-intentioned HR initiatives go wrong.
The importance of HR data analysis is not about being more technical. It’s about being more honest with yourself about what you actually know, what you’re inferring, and what you still need to find out. That discipline, combined with ethical rigor, is what separates HR functions that build genuine organizational trust from those that produce glossy reports no one acts on.
— Mikk
How Sparkly helps you interpret people data with confidence
Understanding your workforce data is one challenge. Having data worth interpreting is another. Sparkly is built on the idea that the most important signals about an employee are not in their CV or skill list. They’re in personality, working style, and how a person fits a specific role, team, and environment.

Sparkly merges four data sources: human observation, AI analysis, psychometric assessments, and Human Design, to produce higher-probability insights that HR teams can actually use in hiring decisions, team restructuring, and engagement conversations. Instead of guessing why someone underperforms or disengages, you have computed, contextualized data that explains the fit gap and suggests a path forward. For HR leaders who want to move from reporting to real decisions, Sparkly gives you the foundation to do exactly that. Explore how role and team fit data can sharpen your HR analytics process across the entire employee lifecycle. âš¡ï¸
FAQ
What is the HR data interpretation process?
The HR data interpretation process is the structured workflow of defining an HR question, preparing clean and validated data, applying analytics techniques, and translating findings into decisions. It moves organizations from opinion-based to evidence-based HR strategy.
What are the four levels of HR analytics?
HR analytics progresses through descriptive (what happened), diagnostic (why it happened), predictive (what will likely happen), and prescriptive (what to do about it) levels. Each level requires different methods and produces different types of decisions.
How do you avoid errors when interpreting employee data?
Avoid confusing correlation with causation, test findings across multiple employee segments, check for regression to the mean in time-series data, and always triangulate quantitative findings with qualitative context before drawing conclusions.
Why is data literacy important for HR professionals?
Only 27% of HR professionals have received targeted training on interpreting the reports relevant to their work. Without data literacy, HR teams risk acting on misread signals and missing the actual drivers of turnover, disengagement, or underperformance.
When is a Data Protection Impact Assessment required in HR analytics?
A DPIA is required when HR analytics involves high-risk processing of personal data, particularly in AI-driven predictive tools. It is a governance mechanism that documents risk and ensures ethical compliance with applicable data protection regulations.