
How to reduce employee turnover: proven strategies for HR leaders

TL;DR:
- Employee turnover incurs high hidden costs, including loss of institutional knowledge and team momentum. Using assessment-driven strategies, organizations can identify root causes, target high-risk segments, and significantly reduce voluntary exits, especially among high performers. Continuous measurement and targeted interventions enable sustainable retention improvements within six to twelve months.
Turnover is expensive in ways that rarely show up on a single line item. Replacement costs range from 50% to 200% of an employee’s annual salary, and the average cost per exit reached $45,236 in 2026. Beyond the dollars, you lose institutional knowledge, team momentum, and the confidence of the people who stay and watch their colleagues walk out the door. Raising salaries and adding free lunches rarely solves the problem long-term. What actually moves the needle is understanding why people leave and using smarter assessment methods to intervene before resignation letters land on your desk.
Table of Contents
- Understanding employee turnover: What’s causing the exits?
- Preparation: Assess your current turnover and identify root causes
- Execution: Implement innovative assessment-driven retention strategies
- Verification: Measuring impact and continuous improvement
- Why conventional wisdom fails: The real keys to reducing turnover
- Take employee retention to the next level with Sparkly
- Frequently asked questions
Key Takeaways
| Point | Details |
|---|---|
| Track voluntary turnover separately | Focusing on regrettable losses helps target high-impact retention strategies. |
| Use root cause analysis | Segmenting turnover data reveals actionable patterns and guides interventions. |
| Predictive assessment drives results | Tools like analytics, surveys, and manager coaching cut turnover and save costs. |
| Measure and benchmark outcomes | Regular review of retention metrics ensures sustained improvement. |
| Feedback prevents costly exits | Listening and acting on employee input reduces preventable attrition. |
Understanding employee turnover: What’s causing the exits?
Before you can fix the problem, you need to see it clearly. Turnover comes in two forms, and treating them the same is one of the most common mistakes HR leaders make.
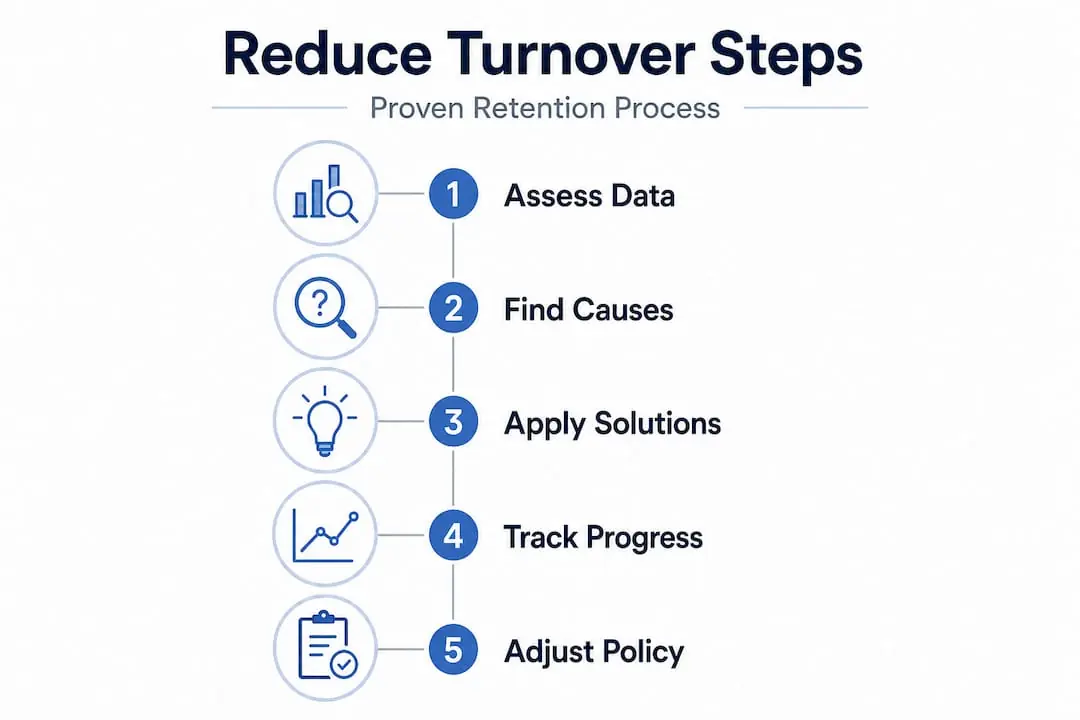
Voluntary turnover happens when employees choose to leave: better offers, poor manager relationships, lack of growth, burnout. Involuntary turnover happens when the organization makes the call through layoffs, performance exits, or restructuring. Both matter, but voluntary turnover is the one that signals something is broken in your culture, your hiring process, or your day-to-day employee experience.
Voluntary turnover should be tracked separately from involuntary, with special focus on regrettable losses of high performers. Industry benchmarks vary widely, and knowing where you stand is the first step toward knowing what to fix.
| Industry | Average annual voluntary turnover |
|---|---|
| Government | 10 to 15% |
| Healthcare | 20 to 25% |
| Retail | 40 to 60% |
| Hospitality | 60 to 80% |
| Technology | 18 to 22% |
If you are a mid-sized tech company sitting at 35% voluntary turnover, you are not just above your industry average. You are burning through talent at nearly twice the expected rate, and the financial and cultural damage compounds every quarter.
The exits that matter most are what practitioners call “regrettable losses.” These are your high performers, your people with rare institutional knowledge, and your emerging leaders. When those individuals leave, the ripple effect is far more damaging than the vacancy itself. Use your employee potential checklist to identify which roles carry the highest risk and which employees are most likely to be poached or burned out before you even realize it.
Here is what to watch for across tenure:
- 0 to 6 months: New hire exits signal onboarding gaps or a mismatch between the role as advertised and the role as experienced.
- 6 to 18 months: Mid-tenure exits often reflect unmet development expectations or strained manager relationships.
- 2 to 4 years: These exits typically signal a ceiling, people who feel they have gone as far as they can and see no path forward internally.
A solid employee retention guide will help you map these patterns to root causes before you start spending on solutions that target the wrong problem.
Preparation: Assess your current turnover and identify root causes
Once you understand the types of turnover and where your organization falls on the benchmark spectrum, the next step is to pull your data apart and look for patterns that point to specific, fixable problems.
Start with segmentation. Do not analyze turnover as a single company-wide number. Break it down by department, manager, role type, tenure band, and location. A 20% overall turnover rate could mean one team is at 5% and another is at 45%. The company average hides where the real damage is happening.
Here is a practical framework for getting started:
- Pull 12 to 24 months of exit data and segment by the variables above. Look for clusters. Is one manager’s team consistently losing people at the 8-month mark?
- Review exit interview data and, if you do not have structured exit interviews, implement them immediately. Ask specifically about manager relationships, role clarity, workload, and growth opportunities.
- Identify your highest-risk segments by crossing turnover rates with role criticality. Roles that are hard to fill and have high turnover deserve priority attention.
- Map early-tenure exits separately. A new hire who leaves in the first 90 days represents a near-total loss of recruiting investment. This segment often reveals onboarding and job-fit problems that assessments can catch before the offer letter is signed.
- Look at high-utilization roles. People who consistently carry above-average workloads are prime burnout candidates. Track overtime, project loads, and PTO usage alongside turnover data.
A mid-sized tech firm reduced attrition 30% in just six months by doing exactly this: running a structured root cause analysis, identifying early-tenure and high-utilization roles as the primary problem, and deploying targeted interventions for those specific segments rather than rolling out a company-wide perk program.
Pro Tip: Use analytics for employee fit to correlate pre-hire assessment scores with first-year retention rates. This is where you start to see which assessment signals actually predict who stays and who leaves within 12 months.
Once you have your data segmented, compare your findings against recruiting best practices to identify whether turnover problems are starting before the first day. Misaligned job descriptions, rushed interviews, and skills-only evaluations are some of the most common culprits, and they are all fixable upstream.
| Root cause category | Common indicators | Priority lever |
|---|---|---|
| Hiring mismatch | High early-tenure exits | Personality assessment pre-hire |
| Manager issues | Team-specific clusters | Manager coaching and accountability |
| Burnout | High-utilization role exits | Workload monitoring and rebalancing |
| Growth gaps | 2 to 4 year exits | Internal mobility programs |
| Compensation | Competitor benchmarking | Pay equity review |
Execution: Implement innovative assessment-driven retention strategies
You have identified your turnover sources. Now it is time to apply forward-thinking assessment approaches that deliver real, measurable results. This is where most organizations skip ahead too fast, jumping straight to solutions without the diagnostic work above. If you have done that work, you are already ahead of the majority of your competitors.

Predictive analytics as your early warning system
Predictive analytics cut retail turnover 15%, saving millions for one major retailer, while a medical practice dropped its turnover rate from 25% down to 10% through a combination of structured surveys, pay and PTO adjustments, and leadership coaching. These are not outliers. They are repeatable outcomes when you use data to act proactively rather than reactively.
Machine learning for turnover prediction uses factors like engagement survey scores, promotion history, workload data, and manager relationship indicators to flag employees who are statistically at risk of leaving in the next 90 days. That gives you time to act: a conversation, a development opportunity, a role adjustment.
Manager accountability as a structural lever
Managers account for a significant portion of voluntary exits. The research is consistent: people leave managers far more often than they leave companies or roles. Yet most organizations measure manager performance almost entirely on team output, not on team retention. Changing that is one of the highest-leverage shifts you can make.
Here is a structured approach to building manager accountability into retention:
- Add retention metrics to manager scorecards. Make voluntary turnover within a manager’s team a tracked and reviewed KPI (key performance indicator).
- Build structured 1-to-1 coaching rhythms. Managers who hold regular, development-focused conversations with direct reports see measurably lower turnover on their teams.
- Train managers to recognize burnout signals early. Missed deadlines, reduced communication, and declining quality of work are early signals that a high performer may be heading for the exit.
- Use assessment data to guide manager conversations. When managers understand the personality profiles and working style preferences of their team members, they can adapt their approach and reduce friction before it becomes a resignation.
Structured mobility and internal growth pathways
Data-driven talent management shows clearly that employees who see a path forward inside your organization are far less likely to go looking for one outside it. Structured internal mobility programs, where employees are actively considered and recruited for open roles before those roles are posted externally, signal that the organization is invested in their growth.
💡 Combine personality assessment data with skills mapping to identify which team members have the highest potential to move into adjacent or elevated roles. This is not just retention strategy; it is succession planning built into your everyday workflow.
Feedback loops that actually drive change
Run structured surveys at 30, 60, and 90 days for new hires. Run quarterly pulse surveys for your broader team. But here is the critical part: close the feedback loop visibly. Share what you heard and what you are doing about it. Employees who see their feedback create real change are far more likely to keep giving it and far more likely to stay. Explore the employee retention strategy blog for practical templates on building feedback loops that scale.
Verification: Measuring impact and continuous improvement
Once your strategies are in motion, ongoing measurement is what locks in the gains. Without it, you cannot tell what is working, what needs adjustment, and where your next spike in turnover might come from.
“75% of voluntary exits are preventable through targeted action on feedback and workload monitoring, yet most organizations only act after exits spike.” 📈
The metrics that matter most:
- Retention rate by segment: Track monthly and quarterly by department, manager, and tenure band.
- Regrettable loss rate: Specifically measure exits of high performers and high-potential employees. This is the number that should drive urgency.
- Early-tenure exit rate: First-year and first-90-day exits tracked separately. A spike here points to a pre-hire or onboarding problem.
- Engagement survey participation and scores: Low participation is itself a red flag, as disengaged employees often stop engaging with surveys before they stop engaging with work.
- Time-to-fill for critical roles: A leading indicator of where turnover pain is being felt most by the business.
Set a regular review cadence. Monthly for high-risk segments, quarterly for company-wide trends. Use HR analytics for teams to automate data collection and surface anomalies before they become patterns.
| Metric | Healthy benchmark | Review frequency |
|---|---|---|
| Voluntary turnover rate | Under 15% annually | Quarterly |
| Regrettable loss rate | Under 5% annually | Monthly |
| Early-tenure exit rate | Under 10% in year one | Monthly |
| Engagement survey score | Above 70% favorable | Quarterly |
| Internal mobility rate | 20 to 30% of open roles | Semi-annually |
Building organizational agility in HR means creating systems that can respond quickly to shifts in turnover data, not just annual reviews that identify problems six months too late.
Burnout in high-utilization roles deserves special attention. Generic wellness perks do not solve a structural workload problem. Track actual workload indicators: hours worked, project volume, PTO utilization, and sick leave trends. These signals often precede voluntary exits in high-utilization segments by two to three months, giving you a meaningful window to intervene.
Why conventional wisdom fails: The real keys to reducing turnover
Here is the uncomfortable truth that most HR articles sidestep. The majority of organizations experiencing high turnover already know the standard advice: pay competitively, offer flexible work, build a recognition program, run engagement surveys. They have often tried these things. And yet the exits continue.
The reason is that most traditional retention efforts treat the symptom, not the source. A pay raise keeps someone for a quarter if the underlying problem is a poor manager relationship or a role that does not match who they actually are. A ping-pong table does nothing for the senior engineer who feels invisible and underutilized.
What actually works is building a deep, accurate picture of each employee as a person: not just their skills, but their personality, their motivations, their working style, and what kind of environment lets them do their best work. Personality-driven engagement consistently outperforms skills-based assessment when it comes to predicting who will thrive in a role and who will struggle. Skills can be taught. Personality is the foundation everything else is built on.
The other critical gap is manager quality and accountability. Organizations invest heavily in executive leadership development and almost nothing in front-line manager development. Yet the front-line manager is the person with the most daily influence over whether a team member feels valued, challenged, and connected. Making manager retention metrics visible and consequential is not punitive; it is honest about where retention actually lives.
Finally, feedback loops only work when they close. Surveys without visible action erode trust faster than no surveys at all. Employees who feel heard and see change are among your most loyal. Use your fit assessment guide to connect personality insights with role design, and you will stop trying to retain people in roles that were never right for them to begin with.
Take employee retention to the next level with Sparkly
Sparkly was built specifically for HR leaders who are ready to move beyond guesswork and generic interventions. Our platform combines personality assessment, AI, psychometric data, and Human Design to give you a more complete picture of each employee than any single source can provide.
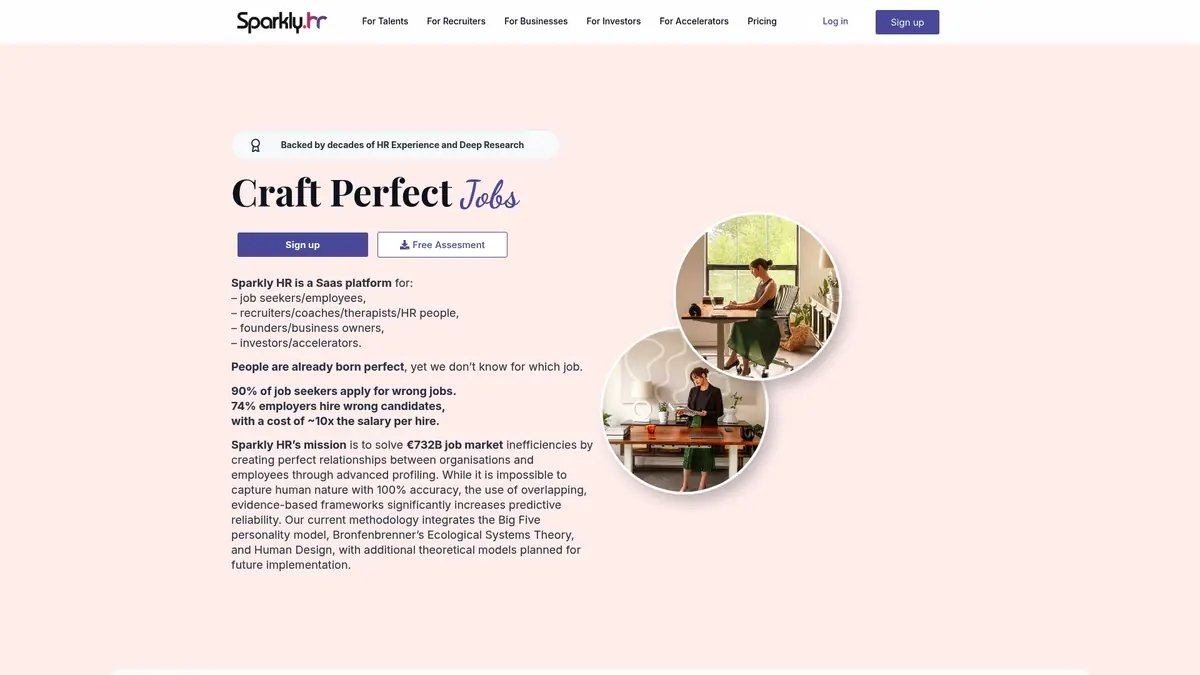
Where most tools assess skills, Sparkly assesses the person. Skills can be learned; personality shapes how someone works, communicates, and connects with a team every single day. Our SaaS for employee potential helps you identify where each team member will thrive, which roles are worth redesigning, and where a shift in team structure could prevent the next wave of exits. Explore our top talent evaluation tools and use the fit assessment guide to start making retention decisions based on who your people actually are. ⚡️
Frequently asked questions
What is considered a good employee turnover rate for mid-sized companies?
Mid-sized companies should aim for under 15% annual voluntary turnover, with close attention to retaining high performers. Industry benchmarks range from 10 to 15% in government all the way to 60 to 80% in hospitality, so context matters.
How much does replacing a single employee really cost?
Replacing one employee can cost between 50% and 200% of their annual salary. Average replacement costs reached $45,236 in 2026, making retention one of the highest-ROI investments HR can make.
Which assessment tools are most effective for reducing turnover?
Predictive analytics, structured employee surveys, and personality-based assessments are among the strongest tools available. Retail turnover dropped 15% with predictive analytics alone, and results improve further when combined with manager accountability programs.
How quickly can turnover rates be improved with assessment-driven strategies?
Significant improvement is possible within six to twelve months. One tech firm cut attrition 30% in six months by targeting early-tenure and high-utilization segments with specific, data-driven interventions.
Are most voluntary employee departures preventable?
Up to 75% of voluntary exits are preventable through targeted action on employee feedback and workload monitoring. The key is acting on the signals before the resignation letter arrives.